Let’s take a look at how to configure the popular Bollinger Bands indicator professionally.
Olymp Trade Calculations used for Bollinger Bands
Bollinger Bands consist of three lines. The line in the middle is a simple moving average and its purpose is to calculate the relative definition of low and high prices in the market. The mathematical formula used to construct Bollinger Bands looks as follows:
BB = MA (moving average) ± k (standard deviation coefficient) * StdDev (standard deviation)
StdDev is calculated by using the formula:
StdDev = SQRT (SUM ((CLOSE – SMA (CLOSE, N))^2, N)/N)
Where SQRT is the square root and N is the number of periods that are used to calculate the simple moving average, e.g. 20 candles.
When calculating Bollinger bands, a standard deviation coefficient (k) of 2 is usually used. With k = 2, 95% of all prices will fall within the price range that is limited by the bands.
Before calculating the standard deviation, the calculation period should be selected. Generally, the same value is used for the moving average and the smoothing coefficient.
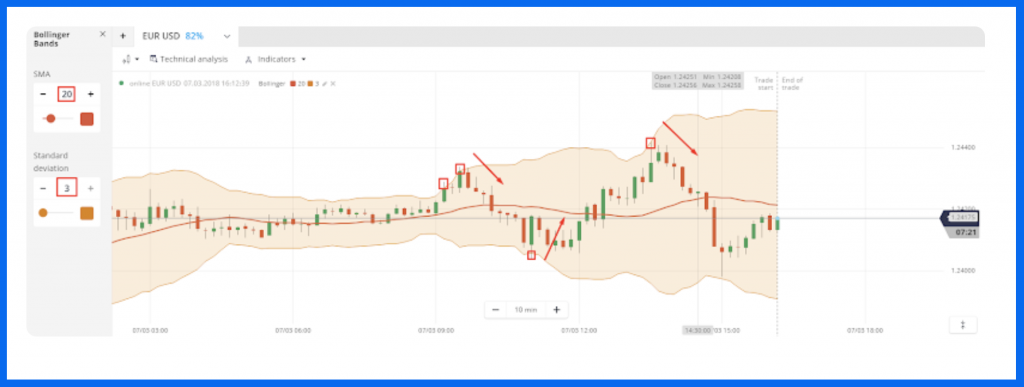
Periods
The recommended number of periods used for Bollinger Bands is between 13 and 24, with 20 being used most often. A deviation of between 1.5 and 5 is usually selected, while the recommended value is between 2 and 3.
The number of days in the trading calendar year (240, 365), round numbers (50, 100, 150, or 200) and Fibonacci numbers can also be used. A large number of periods however reduces the indicator’s sensitivity, and is therefore unsuitable for use in low volatility markets.
Although prices mostly moves within a channel, they can cross Bollinger Bands when there is sudden movement. If the price however crosses the lower or upper band too frequently, the period should be increased, while the period should be decreased if the price hardly ever reaches the outer bands.
Time Frame and Price
Although Bollinger bands can be used with any timeframes, they are normally used for day trading. Settings for different timeframes and different currency pairs are configured separately.
Although Bollinger Bands calculations are most often done by using closing prices, weighted average or normal average prices can also be used.
The indicator’s main signals
- Trading the center band
If the price intersects the center band while moving downwards, the signal is bearish. If the price intersects the center band while moving upwards, the signal is bullish.
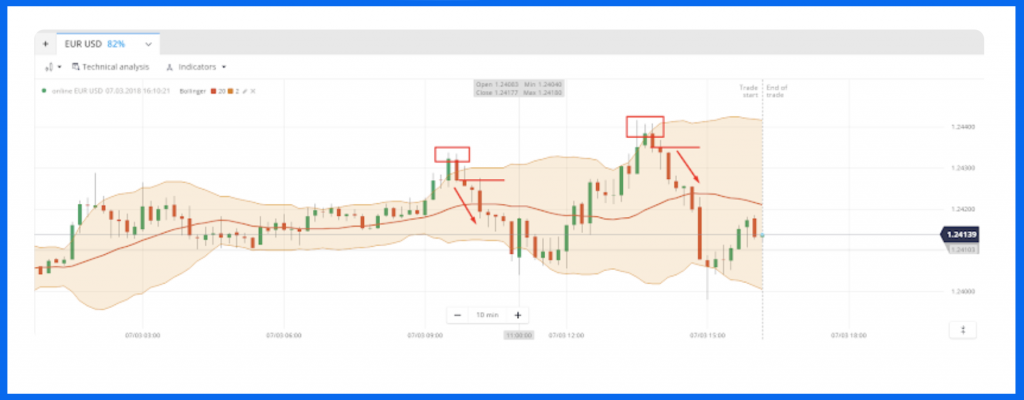
- Trading after the price moves back into the channel.
Open a position against the point where the price leaves the indicator band. Once the bar / candle closes inside the indicator, a position should be opened towards the middle band. This entry point is very much the same as standard entry points used with oscillators.
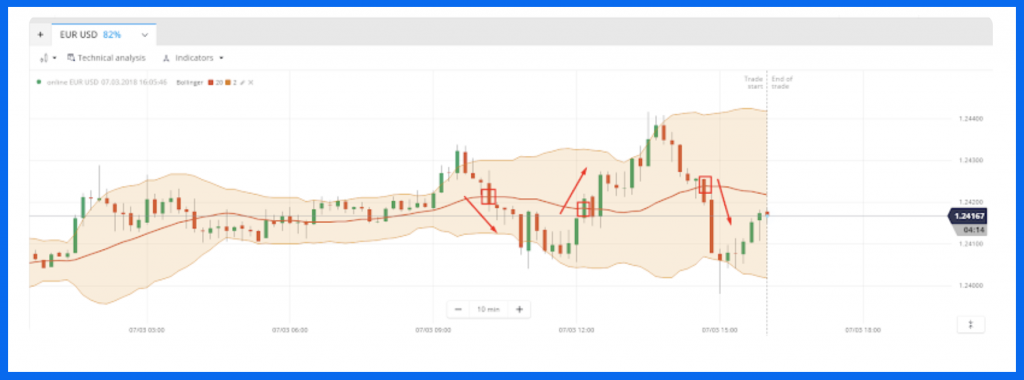
- Using the outside bands.
The bands are automatically adjusted to form dynamic resistance / support levels for the current movement of the price. A good time to sell would be when the upper resistance level of is approached, while it makes sense to buy when the lower support level of is approached.
Tips & Tricks
John Bollinger, the creator of this indicator, provides the following recommendations:
- A price movement that starts at one side of the band will normally reach the opposite side. This behavior can be handy to predict price benchmarks.
- If bottoms and peaks outside the band are followed by bottoms and peaks within the band, a trend reversal may occur.
- After the band narrows, sharp price changes normally happen, meaning that volatility is decreasing.
Good trader training and deep knowledge is required to use the professional setting of Bollinger Bands and any other indicator successfully. Trade with confidence by taking part in Olymp Trade’s training webinars!