Let’s have a look at the RSI oscillator, giving you a general idea of how it works, discuss some of its characteristics and explain how it can be adjusted professionally. Just as any other oscillator, there are a number of general principles that should be kept in mind when the RSI is configured:
- Once the history of an asset has been analyzed, the rule of local patterns can be applied, i.e. if the trend reverses many times at the same RSI percentage, another trend reversal is likely as soon as the trend returns to the same rate.
- The trend reversal is more likely the farther the indicator moves into the zone, i.e. below 30% or above 70%.
- When the indicator graph moves to the standard zone, i.e. below 30% or above 70%, is does not signify a reversal, but is rather a warning that a trend reversal will start soon.
Although the standard settings of the RSI zones are universal at 70% and 30%, these can be changed to improve the effectiveness of the indicator. This can be done in one of 2 ways:
RSI Method 1
Based on point 2 mentioned above, the oversold and overbought zones for any asset can be narrowed. Don’t for example use 70/30, but 74/26, 78/22, etc. This will result in the quantity becoming quality, i.e. we will get fewer signals from the indicator for narrower zones, but the fewer signals will be of a better quality.
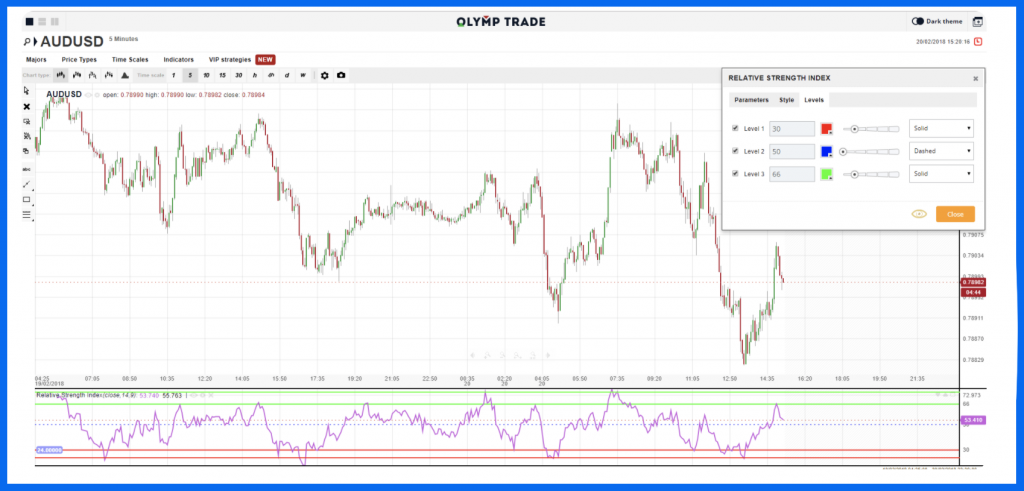
To configure the RSI oscillator on Olymp Trade’s platform, select a separate “Technical Analysis” window. You can see how to configure the indicator for the AUD/USD exchange pair in the image below.
RSI Method 2
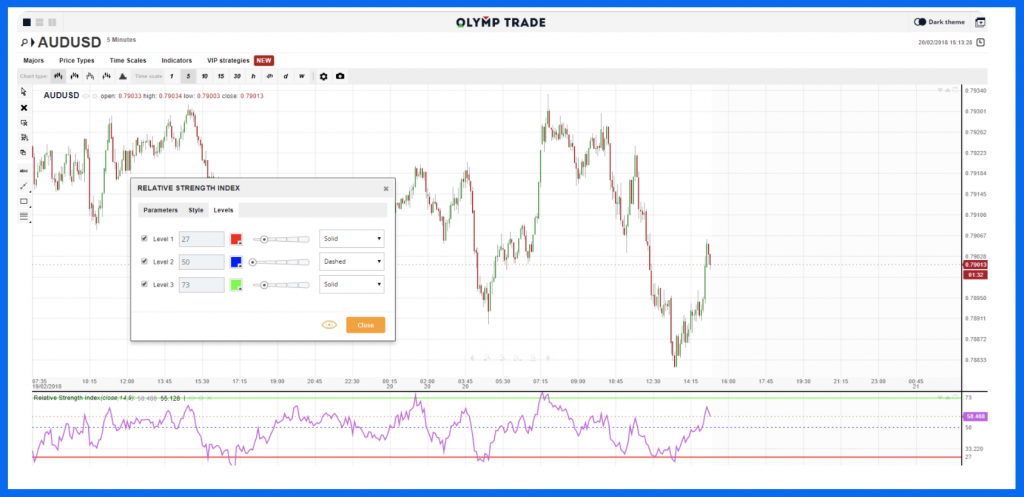
Based on point 1 above, the indicator can be configured even more accurately for a specific asset. As an example, let’s configure the AUD/USD exchange pair for two trading days and 5-minute candlesticks.
Looking at the local patterns, we can see that trend reversals have already taken place. We therefore adjust the indicator zone by the maximum number of reversals, the same as we would do when working with the resistance and support levels. In this example, the oversold zone will stay at 30%, which is the default setting.
Next we need to define the zone levels. The locally configured zone start is the level of zone 1, which is 30% in this example. Zone 2’s level is define in the same way as the automatically constructed levels are determined, i.e. by using the peak values of the day.
These will be the indicator’s peak values in each zone. The horizontal line tool can be used to indicate these. In this example, it is indicated by the red bottom line at 24%.
The overbought zone levels are configured in the same way. Locally, these will be at 66% and 75%. The trading principle that will be used is that if the trend reversal doesn’t begin at the zone 1 level, we will have to wait until it approaches the zone 2 level before receiving a one-touch signal. Note that we should not trade the reversal in the gap between the levels.
OlympTrade RSI – Tips & Tricks
Don’t set the zone 1 levels above 40% and below 60%, as this scenario probably indicates that the asset has a low volatility, and it is therefore not a good idea to trade it.
It should also be noted that configuring the RSI indicator in these ways will be different for each asset and the candlesticks’ time frame. It will also require continuous adjustment – every time peak values break out of zone 2, or at least once per day.
Before starting to trade in a separate technical analysis window with 5-minute candlesticks, it is recommended that four zone levels be determine for each asset, while the chart should be scaled to two trading days. If other candlestick timeframes are used for analyzing and trading, it should be noted that that the RSI will be reconstructed if the timeframe is changed, and this will lead to the zones being reconstructed. For ease of use when trading, we recommend you write down the current values of the assets’ zones.