There are many factors that affect trading results. Although some of them are outside your control, you can continuously work on your money management and psychology. These skills are however not of much use unless you are able to predict what the price of an asset will be.
Any successful investment begins with a good entry point. This is however something that neither capable money management nor strong psychology can assist you with. During every trading session, it is crucial that you understand when a down or up trade should be opened.
Olymp Trade provides you with many tools that can be used to predict which direction the price will go and the trick is to select the forecasting technique that will work best for you. We have therefore written this article explaining the most effective and popular trading techniques available on Olymp Trade.
We’ll provide a brief description of the techniques so you will be able to use this information to gain further knowledge. Despite its concise format, the information will help you get a good grasp of the many different approaches that you can use when trading.
Economic News
Ministries of different countries issue economic news in the form of regular reports. Investors then use these to determine if all is well with the region or country’s economy.
The economic calendar provides the schedule of these releases in advance and contains expert forecasts, information on the type of report, and the time and date when the publication is due to be released.
The experts at Olymp Trade have also prepared 3 new basic trading strategies that use economic news. These can be found on the platform’s official blog.
Use Technical Analysis Patterns for Trend Analysis
One of the most popular tools used by traders to analyze market is technical analysis. Technical analysis has been studied actively since the start of the twentieth century and over the years, traders have compiled a comprehensive set of working patterns that are commonly used.
Nowadays, patterns is a specialized subdivision of technical analysis. It can also be described as chart movement schemes. If an asset chart resembles a specific known pattern, it helps traders to determine in which direction they should open a trade.
The gold chart shown below provides a good example. The pattern shown is known as “head and shoulders”. This pattern is known as a reversal formation, as it signals a change in the direction of the trend. As shown, it contains three elements: L (left shoulder), H (head) and R (right shoulder).

There are numerous other successful patterns, including diamond, triple top, triangle, etc.
Analyzing Earnings Reports
At first glance, it may seem as if analyzing earning reports as offered by Olymp Trade is mainly aimed at professional accountants and financiers. This is however not the case. When trading a company’s stocks, you don’t want to buy the whole company, but only need to follow their stock’s trends. Although it would not necessarily be a bad thing to learn about things like EBITDA and EBIT, you don’t need to know anything about it to trade a company’s stocks.
When trading a company’s stocks, traders are most interested in dividends and profits. If a company reports that its latest quarter was not profitable, there is a good likelihood that its shares price may start falling. The asset price may for example also drop if the board of directors made a decision to invest in a dubious startup rather than paying out dividends.
Stable corporates like Google, Microsoft, IBM, Facebook, and Apple generally perform well and their share price keeps on rising unless these is a huge crisis like the current pandemic. Olymp Trade in fact offers its clients the option to sell or buy any of these assets using a multiplier of 20. This allows traders to increase their potential profit by 20 times.
Price Movement
Some traders are of the opinion that tracking an asset’s price movement is the most effective approach that can be used for intraday trading. Price movement or price action not only shows you how to find entry points for any trading mode and market, but also teaches an understanding of the markets in general.
To start trading on price action on Olymp Trade, you will first have to gain a good understanding of resistance and support levels. These are types of asset price limits that help traders determine in advance where the asset’s price will reverse its current trend.
The second thing you’ll need to understand is a bar chart or Japanese candlesticks. These are different methods used to present market trends which give traders a detailed picture of price lows and highs over a specific period.
Price Action’s underlying concept is to get visual confirmation of which group currently dominates the specific market — bears or bulls. If candlestick highs are for example increasing, this is a clear signal that the bulls (buyers) currently have the power. It is good to find entry points that are close to the resistance and support levels.
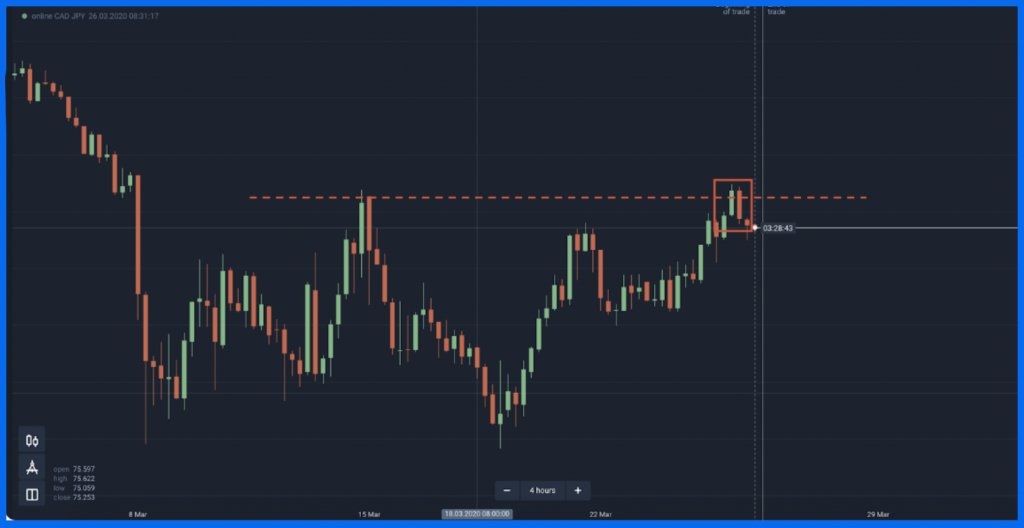
Look at the gold chart we used previously, this time shown with candlesticks. There are three candlesticks close to the resistance level. This is the red horizontal line that signifies a level the price could previously not get above. As the candlesticks’ highs were declining, this could be a good moment for price action traders to enter a down trade.

Fibonacci Methods
Based on the scientific studies of a mathematician, Leonardo Pisano, Fibonacci methods are an often used group of price analysis techniques.
In the example shown below, the grid has been set using the visual low and high, and the other levels will appear automatically. As demonstrated, the Fibonacci levels can identify the asset price reversal points in advance. In this example, traders could make a down trade at least twice to make a profit.

In the EUR/GBP chart shown below, Fibonacci levels produced a massive amount of both down and up signals.

Oscillators
Although it may seem simple to learn how to enter trend-following trades, it’s not. You’ll first need to learn how to interpret the trends, assess their strength, and then find price targets.
Traders often look for price reversals when they do intraday trading. One of the ways they do this is by using oscillator indicators to get reversal signals.
These indicators include ones like Stochastic, RSI, DeMarker, CCI, ADX and many more. The working principle of oscillator indicators is often very simple: it has a bottom zone (oversold) and a top zone (overbought). If the indicator line enters either of these zones, it shows that the asset is either oversold or overbought, i.e. the price has risen or dropped too much. This is the time that a reversal is likely.
On the image shown below, the RSI and CCI lines enter the zones above or below the shaded channels. Although the asset’s price rose and then declined, only to rise again later, the oscillators helped traders determine their entry points.

Moving Averages
A popular and often used indicator is the Simple Moving Average (SMA). This indicator clearly shows an asset’s average price over a specific period. If the SMA settings contains the period of 50, the average price is calculated by using the last fifty candlesticks.
The assumption is that the asset’s price will tend to drop if the asset’s price is below the SMA line. When the price however moves higher than the SMA line, buyers will have additional opportunities to make a profit.

Newspaper Reports, Panic and Rumors
It is possible to trade profitably without analyzing any chart at all, but to do this, you’ll need to be patient. To do this, you’ll need at least basic understanding of international relations and politics.
Here are several examples:
- Stock prices tend to drop sharply if a company experiences turmoil in the board of directors, or if senior managers are dismissed. Tragic circumstances will also cause stock prices to plunge, as was the case with Boeing and its bestselling 737 MAX aircraft. Aircraft crashes in Indonesia and Ethiopia resulted in this model being grounded by aviation authorities, and this in turn led to massive loss of income, as well as increased costs.
- The spread of the COVID-19 coronavirus globally has led to business activity in the European Union and the United States grinding to a sudden halt. Businesses no longer operating and not being able to generate revenue and profits has caused the GDP in many countries to fall and this has had a huge negative impact on both the stock market and exchange rates.
- Whenever North Korea launches missile or conducts nuclear tests, the Nikkei 225 and other Japanese stock indices tend to drop.
It can be this simple to find assets that you can buy or sell profitably.
Using Analytics and Trade Signals on Olymp Trade
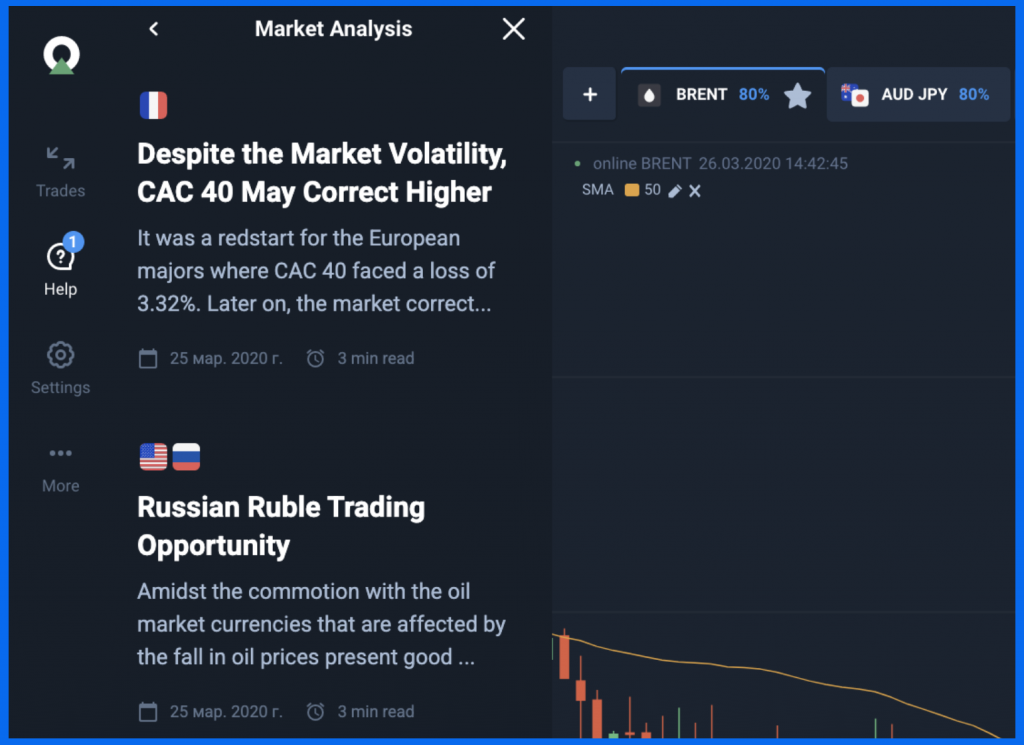
The experts at Olymp Trade are all experienced investors who have for many years been trading in financial markets. On a daily basis, they publish many interesting analytical notes.
These daily reviews can be found on the platform’s blog. Either make use of the information about important events in your trading strategy, or use 1 of 3 scenarios of different assets’ price movements.
Traders with Expert status get access to analytical reviews that include 7 forecasts for stocks, indices, currency pairs, and other assets. This is plenty of information you can use to make well-informed trades without having to spend much time at all.
There is also plenty of interesting information available on the trading platform that will help you select which asset you want trade and predictions on the direction the asset is expected to trend.
Personal Trading Instructors
Olymp Trade clients all have the opportunity to move from basic trading to an independent level fast, thanks to Olymp Trade’s personal financial consultants. Although clients on the Advanced status already qualify for periodic consultations with consultants, only traders at the Expert level get intensive, effective training.
These consultations include the following:
- A consultant will help you determine the exact type of theoretical training you require and will helps you get it.
- Personal trading instructors use their own examples to show you how you can make trades, how to prevent making losing trades and how you can manage your money.
- The financial advisors also teach traders how to control their emotions and keep calm while trading.
In addition, Olymp Trade’s experts run a signal service on the platform. Apart from making recommendations, traders also receive a brief commentary on why the recommendation was made.
This list of methods that can be used to analyze asset prices when you’re trading on Olymp Trade is not complete by any stretch of the imagination. It does however give you some idea of the many directions available to you to move in.
It should also be noted that all the techniques explained in this article can be combined with others. This symbiosis can either be used to obtain even more signals, or to check the reliability of your data.
One of the main things you should do once you’ve started trading is never to stop. Each and every trade will add to your experience, and this means you are on track towards your financial goals.
